HBAR’s price remains within a falling wedge pattern after a recent 35% decline. This technical structure still allows for a potential price rebound.
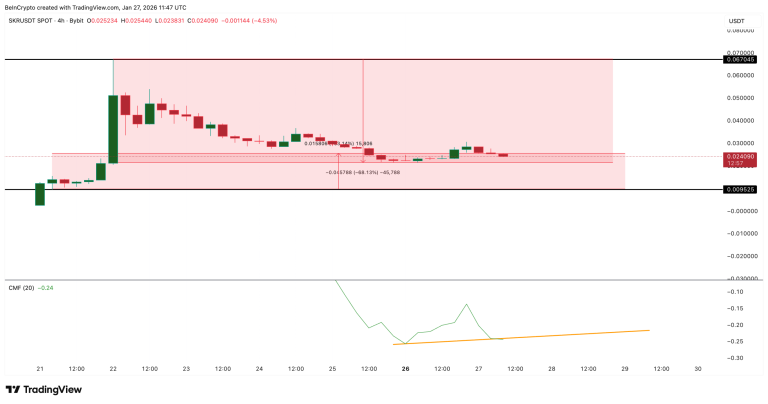
Money flow indicators suggest some buyers are stepping in. The Chaikin Money Flow (CMF) shows that capital entered the market even as prices fell between late December and early February. Although the CMF has dipped recently, it remains near neutral levels.
The Money Flow Index (MFI) also shows a similar pattern. It has been trending higher since late November while the price trended lower, indicating traders have been buying during dips. The MFI is currently near 41. A move above 54 would strengthen this bullish signal.
Together, these indicators suggest dip buyers are active and capital has not fully left the market. This keeps the possibility of a recovery alive.
However, volume data presents a more cautious picture. The On-Balance Volume (OBV) indicator, which measures whether volume supports price moves, has been weakening. It broke below a key trendline in late January and has been trending lower since October. This creates a bearish divergence.
This weakening volume suggests the broader market is not absorbing selling pressure as effectively as before. Without stronger volume support, any price rallies may struggle to sustain themselves.
Given these mixed signals, key price levels become crucial. Holding support at $0.076 is important for a recovery attempt. If this level fails, the price risks further declines toward $0.062 and potentially $0.043.
In summary, while some technical indicators show buyer interest, weakening volume poses a risk. The price action around the $0.076 support level will likely determine the short-term direction for HBAR.